
Blog
Does battery performance determine electric vehicle cost? Unpacking the EV pricing puzzle
By Stephanie Tarczynski, Director of Product Engineering and Commercialization, and Robin Yu, Data Science Intern
At Aionics, we harness the power of artificial intelligence and physics-based simulations to design cutting-edge, customized electrolytes for high-performance electrochemical systems, including electric vehicle (EV) batteries. Our mission is to drive the clean energy revolution forward by creating next-generation materials that improve battery performance, enhance safety, and reduce costs.
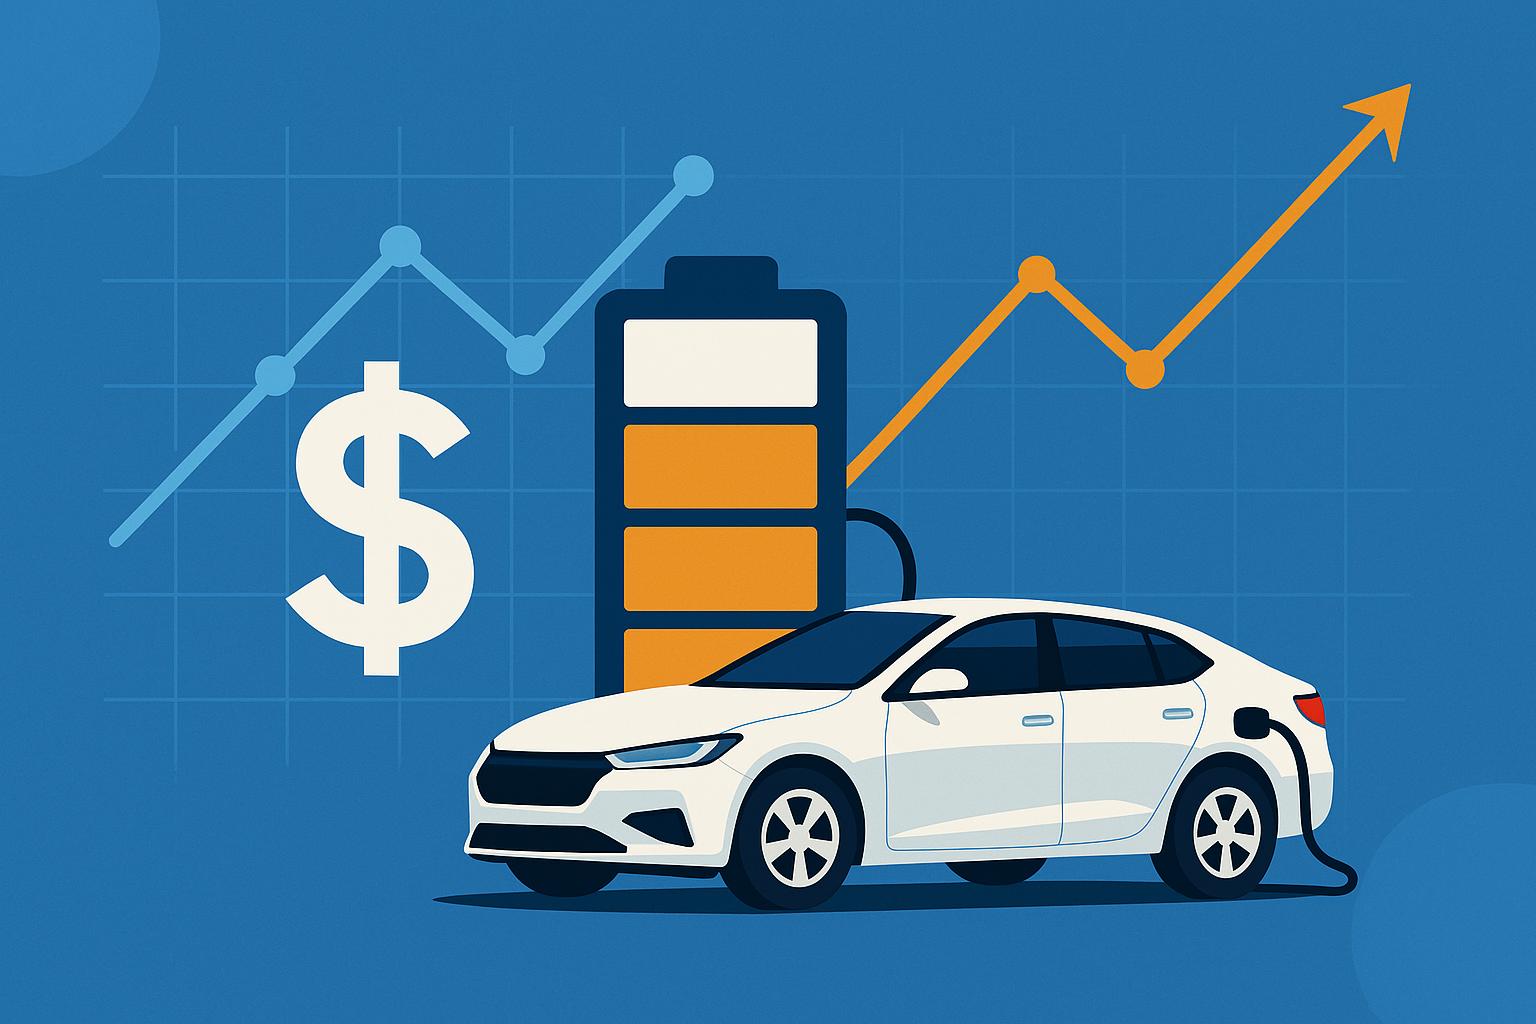
In today’s fast-moving EV market, battery technology plays a crucial role in shaping vehicle pricing and consumer appeal. Key factors like power, range, and weight significantly influence pricing across market segments, and consumers are generally willing to pay a premium for higher performance in their EVs. At the same time, recent changes in policy, brand perception, and international trade agreements have underscored that EV prices can shift rapidly and independently of their battery performance.
With that in mind, we set out to determine how battery performance influences EV pricing. We wanted to answer a simple question: can I predict how much an EV will cost based on its battery specs? As developers of advanced electrolyte technology, we develop drop-in solutions to help automotive companies advance their battery performance along key metrics that matter: cycle life, charging time, power output, safety, high and low temperature stability, and more. In addition to shedding light on the value proposition of new high performance batteries, this type of analysis can also help us understand how consumer behavior might evolve in the EV market over time.
Jumping In
To dive deeper into the relationship between electric vehicle (EV) specifications and pricing, we took a data-driven approach: we built a detailed, multi-year trim-level dataset of EV metrics and prices, going back until many models were on the market for the first time. We are limiting this analysis just to the 2023 US market; research on the larger market dataset is continuing internally at Aionics.
By pulling together data from trusted sources—like vehicle specs, performance features, and pricing details—we can create a clearer picture of what drives EV costs and sales. Focusing on trim-level details let us capture the differences in battery size, power, range, and other features that influence pricing across different segments. The sources include FuelEconomy.gov, along with manufacturer-reported vehicle specifications and sales figures.
While it’s already widely acknowledged that batteries are a major cost driver for EVs, our analysis reveals just how closely battery size and performance correlate with a vehicle’s specifications—except in the case of luxury EVs, where other factors tend to outweigh battery considerations. This highlights the pivotal role of both battery technology and brand appeal in defining market trends and consumer preferences.
For each vehicle type in our dataset, we aggregated the following 2023 data:
- Price (USD)
- Sales
- Weight
- Horsepower
- 0-60mph time
- Range
- Battery Capacity
- Battery Specific Energy
- 240V charge time
Below, we plot a correlation matrix that highlights correlations between these variables.

The correlation matrix highlights the relationships between various EV metrics and their prices. Strong correlations exist between price and horsepower (0.75), weight (0.55), and charge time (0.47), suggesting that more powerful, heavier vehicles with longer charging times tend to be pricier. However, the weak correlation between sales and price (-0.08) suggests that the market is diverse enough to minimize the impact of price alone.
Predicting price from range, weight, and horsepower
To understand the connection between price and battery performance, we mined the data for relationships between these variables. We assessed many different combinations of the battery performance features and looked at their correlation with EV price. We found one particular surprising combination that had a strong correlation with price:
EV price ~ (range) × (vehicle weight) × (horsepower)
This composite metric captures three key elements of battery performance. By multiplying them together, the composite metric ensures that all three values must be high for the composite value to be high.
To tease out market dynamics a bit further, we also separated the data into five classes:
- Low cost EVs (“low end”)
- Mid-range cost EVs (“mid-range”)
- High cost EVs (“high end”)
- EV trucks
- EV vans
The resulting data is shown below. The R2 of the overall correlation is 0.64, showing that EV price is generally predictable from this composite metric. Furthermore, the various EV classes are relatively well separated from each other.

In the mid-range and low-end segments, where consumers are more cost-sensitive and prioritize functionality over luxury, the correlation between performance and price is strongest. This is evident in how these vehicles cluster closely around the y=x line in the graph, suggesting that improvements in range, weight, and horsepower lead to proportionate price increases. Here, the pricing structure is more straightforward, aligning closely with the actual performance capabilities of the vehicles.
However, the deviation from the diagonal line seen in the high-end luxury segment suggests that non-battery factors are coming into play: other on-board technology, premium materials, design elements, and brand prestige can all come into play. These elements can result in a price that’s inflated beyond what battery performance metrics alone would suggest. For instance, a luxury EV may not necessarily have better range or horsepower than a high-performing mid-range model, yet its price could be significantly higher due to the inclusion of luxury features. As a result, the combined metric becomes less predictive for luxury brands, as the price variance is driven by factors outside of pure performance.
This luxury effect creates dispersion in pricing within the high-end EV category, making it harder to capture pricing patterns based solely on range, weight, and horsepower. Nonetheless, the combined metric has good predictive power. The graph’s clear separation of vehicle categories underscores the difference in pricing dynamics, highlighting how luxury introduces an additional layer of complexity in the premium EV market.
Correlation among metrics
The correlation matrix in Fig. 1 suggests that correlations exist among the (non-price) battery specs. To dive into this further, we analyzing the relationship between key technical specifications with cost as only a secondary matter.
First, when examining the relationship between charge time (240V) and range, a positive trend emerges. Vehicles with longer charge times tend to offer a greater range in miles, although the correlation is moderate. This makes sense: larger batteries take longer to charge but give you more range. Price has a correlation here once again: Higher-priced vehicles typically offer greater range, which often comes with longer charging times. However, the plot does show some interesting semi-outliers: some high end vehicles in the 10- to 12-hour charging time range, and some low end vehicles in the 14-hour range. Generally speaking, only low end vehicles are able to charge in less than 8 hours on 240V, which likely reflects their smaller battery capacity (and thus cheaper cost).

Shifting focus to the relationship between horsepower and vehicle weight, a stronger positive correlation is visible. This reflects the fact that more powerful EVs, which typically deliver greater horsepower, also tend to weigh more. Once again, price trends align with this relationship: more expensive EVs are usually equipped with higher horsepower and greater weight, likely due to the enhanced batteries and advanced engineering required for their performance capabilities.
Both plots highlight how price is linked to the optimization of technical specifications, revealing that premium vehicles typically better performance in terms of range, horsepower, and weight — but not always. There is meaningful variation across brands and models.

Range-to-weight ratio
The range-to-weight ratio is an interesting factor that deserves a bit more focus: bigger batteries have more range, but are more expensive. But does this affect the overall price of the car? Plotting price versus range-to-weight ratio shows a poor correlation. It does not seem that the price of an EV can be inferred from its range-to-weight ratio. For example, there are EV models that cost $175,000 and $25,000 and yet have nearly identical range-to-weight ratios. It seems that high end EV manufacturers are not able to squeeze more range out of a given pound of vehicle weight. This likely is a reflection of just how dominant the battery weight is relative to all the other car components — and most EVs are using approximately the same batteries.

Range, charge time, and sales
Finally, we want to explore whether an EVs range and charge time are predictive of its overall sales. The short answer: not really.
In Figure 6, we plotted EV sales numbers in 2023 against the ratio of range to charge time. We might expect that high performance EVs should have large values of the range-to-charge time ratio. Again, we see this is not necessarily true: large range-to-charging-time ratio values are found all across the cost spectrum.
However, there does seem to be some positive correlation here: EVs offering more range per hour of charging tend to sell better. In fact, the best selling EVs are moderately priced but have very high range-to-charge-time ratios. Vehicles like the Tesla Model Y and Fiat 500E, which have higher ratios, stand out with significant sales numbers. This suggests that consumers value the convenience of getting more range for every hour of charging, irrespective of EV cost. This metric makes a lot of sense if you’re using your EV frequently and are regularly recharging.

Conclusion
This analysis highlights the multifaceted relationship between battery performance and EV pricing, and shows that some EV prices can be predicted from battery performance!
We found that while battery specs like range, weight, and horsepower are strong predictors of cost in low- and mid-range vehicles, but their influence diminishes in the luxury segment, where brand prestige and premium features take precedence.
After searching the data for some useful composite metrics for predicting EV price, we found that the composite metric of range × weight × horsepower proved to be a useful predictor of price for most vehicles, with an R² value of 0.64. However, as noted, this composite doesn’t perform well for luxury brands, where consumers are considering other factors beyond battery performance.
Additionally, we see an interesting but modest correlation between sales and range-to-charge-time ratio, suggesting that practical convenience, rather than raw performance or efficiency, resonates with many EV buyers. This also suggests that decreasing charge time per mile of range is an important metric to capture mass consumer interest. EV manufacturers would be well-served to focus on improving battery charge time. Fast charging can come at the expense of the long-term battery health, but that metric is not represented in this dataset and we do not yet have a clear sense across the industry for how much battery cycle life affects EV sales or pricing, if at all.
Taken together, these points can inform future EV battery development, like we do at Aionics, Inc. Our proprietary AI-driven battery design platform enables us to build batteries with custom performance specifications, and we are actively working with next-generation air and ground mobility companies to deploy these batteries. This study reminds us that EV cost is still very much tied to battery performance, except in high-end cars. This means high-end automotive manufacturers are less sensitive to battery cost or performance, while low- to mid-range automotives will be highly motivated to increase battery performance and decrease cost. Range, weight, horsepower, and charging time look to be the key metrics to improve — in battery lingo, that’s the energy density, discharge rate capability, and charging rate capability.
Thank you for reading. This analysis was conducted on a subset of our data and not all insights have been shared publicly. If you’d like to learn more about the ongoing EV market research and data collection at Aionics, please don’t hesitate to reach out to us at partnerships@aionics.io.
Additionally, did you know Aionics AI platform can optimize existing electrolyte formulations to improve their charge and discharge rate capability, cycle life, safety, and temperature performance? If you’re an EV manufacturer looking to leverage the AI revolution to supercharge your EV battery development, we would love to hear from you! Please contact our team at partnerships@aionics.io. We’d love to hear from you!
By

Director, Product Eng and Commercialization

Data Science Intern
Newsletter Registration
Subscribe to our newsletter and stay updated with the latest from Aionics.