
Blog
Principal Scientific Developer Dr. Jeremy Monat Contributes MolsMatrixToGridImage to RDKit Open Source Cheminformatics Library
A rising tide lifts all boats.
That’s what we believe at Aionics. When it comes to the study of materials informatics and cheminformatics, the more accessible and robust open source software tools, the better. Although our business relies on us building our own proprietary materials informatics and simulation software, we believe it is important for the community at large to have the best tools at their fingertips, too.
With that in mind, we are proud that Aionics Principal Scientific Developer Dr. Jeremy Monat has made a substantial contribution to the RDKit open source cheminformatics toolkit. This contribution was recently highlighted on the RDKit blog article, “Plotting rows and columns of molecules with MolsMatrixToGridImage.”
Dr. Monat contributed MolsMatrixToGridImage to RDKit, which was just released in the 2023.09.1 RDKit release. MolsMatrixToGridImage is a game-changing addition to RDKit, enabling scientists to plot molecules in a grid layout effortlessly. It simplifies molecular visualization, streamlining the creation of publication-ready images. Key advantages include:
Enhanced Visualizations: Researchers can create precise, structured representations of molecular data, facilitating a deeper understanding of complex chemical compositions.
Efficiency: Save time and effort by automating the creation of publication-quality molecular grids.
Versatility: Customize the grid layout, molecule display, and image size to match your project’s needs, making it simpler to organize data and visualize chemical concepts in a two-dimensional grid.
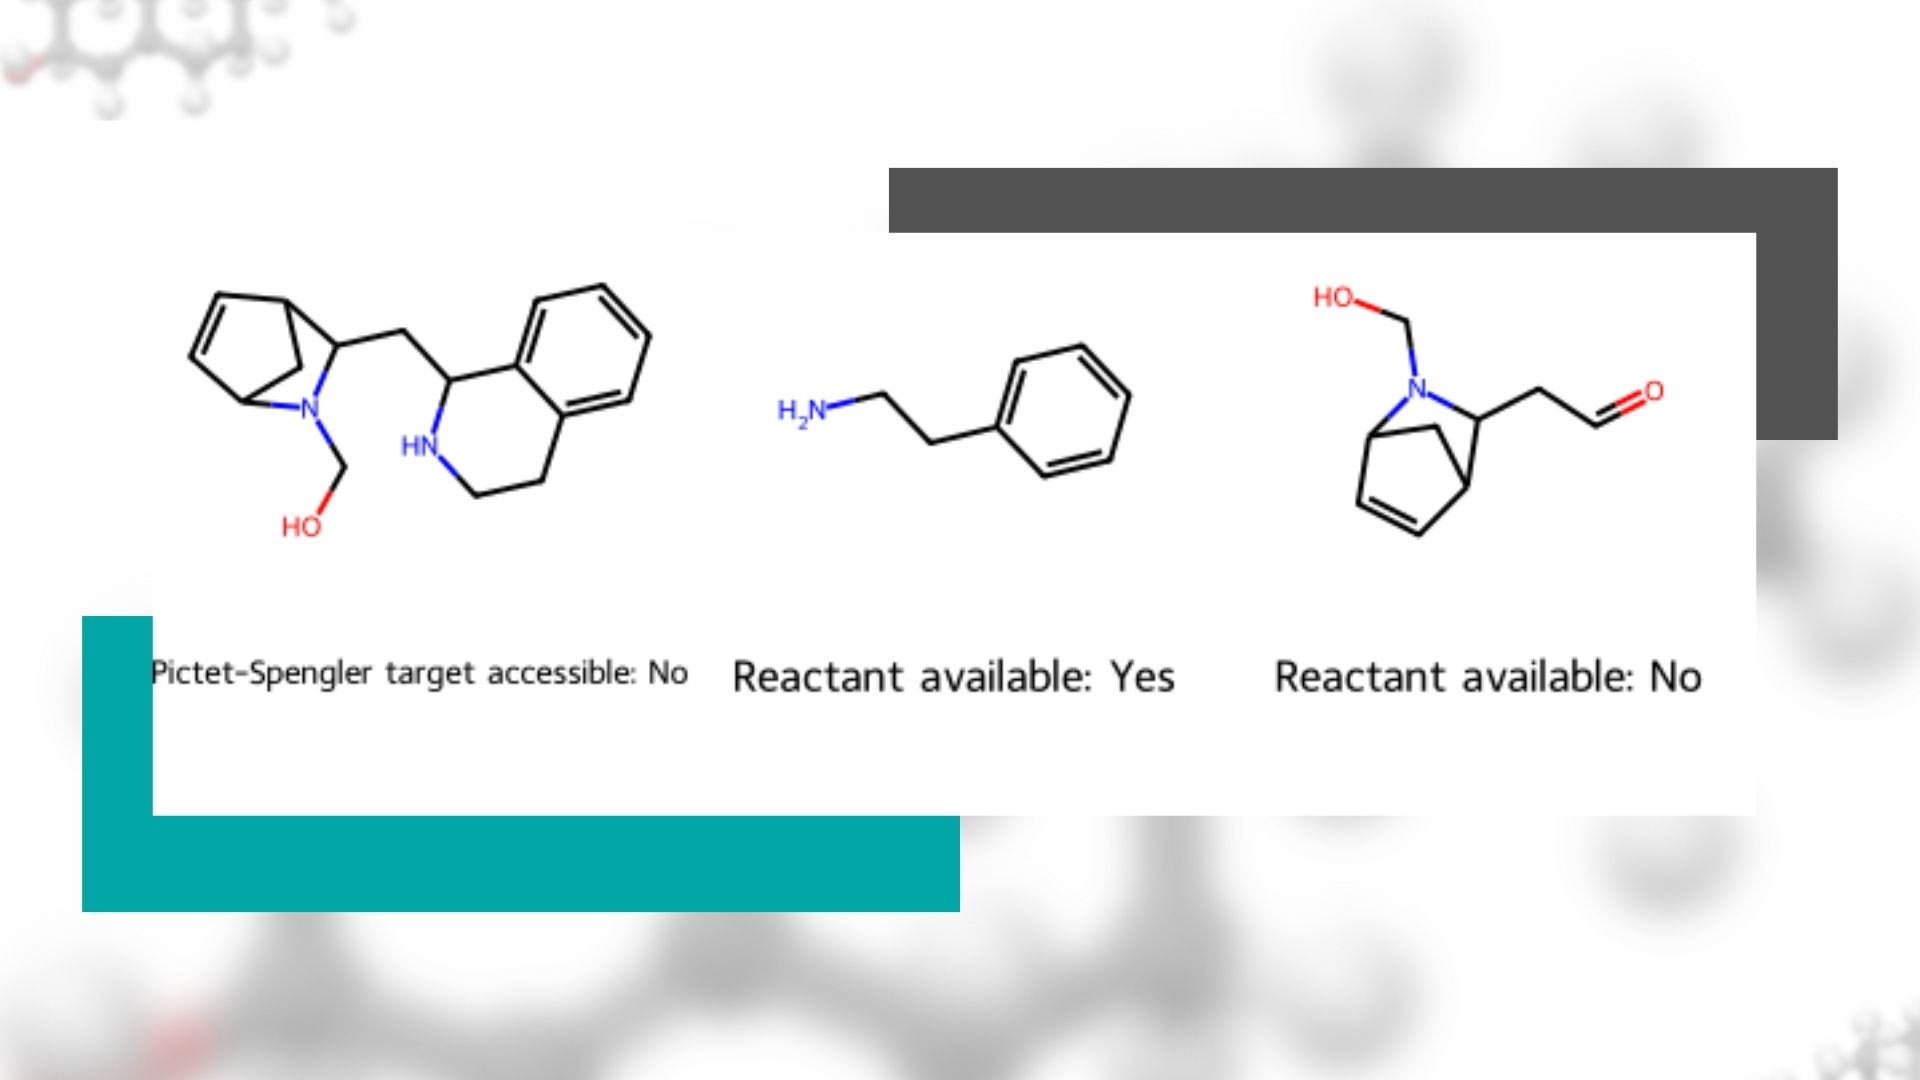
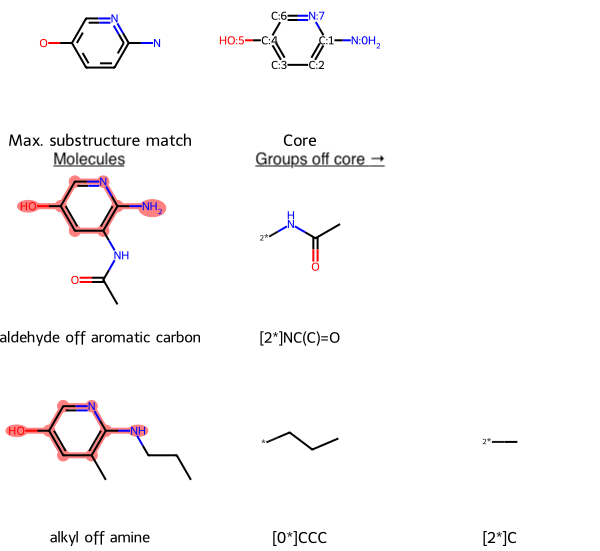
This functionality can be useful for understanding the properties of groups of molecules, including their synthetic accessibility, finding the maximum common substructure, and retrosynthetic analysis.
For instance, when considering variations on a molecular core to achieve desired properties, it is helpful to compare the groups off the common substructure. Because each candidate molecule can have a different number of peripheral groups, MolsMatrixToGridImage facilitates visual comparison by putting each candidate and its peripheral groups in its data structure. So the cheminformatician need not consider how many peripheral groups each molecule has: MolsMatrixToGridImage will automatically create enough columns to accommodate the molecule with the greatest number of peripheral groups and place blank cells in other rows as needed.
Head over to the RDKit blog to learn more!
By

Chief Executive Officer
Newsletter Registration
Subscribe to our newsletter and stay updated with the latest from Aionics.